
The network upgrade bill is usually what decides whether a generation project gets built. It is also, uncomfortably, not really a property of the project.
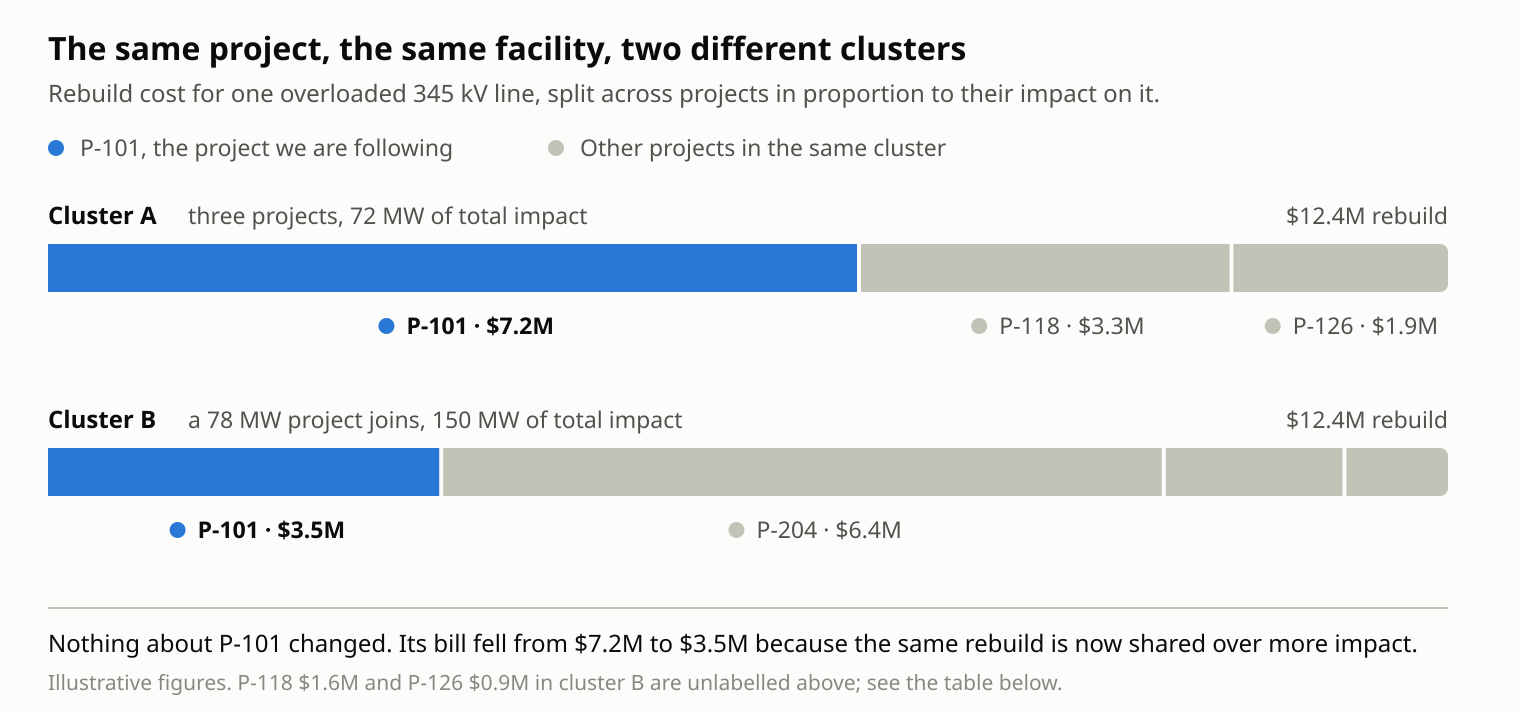
Same turbines, same point of interconnection, same base model. Put that project in a different cluster and the number changes. It depends on which other projects are studied alongside it, where they connect, what the group overloads together, and how that market divides the cost of the fix. A developer can do everything right and still get a number that was mostly determined by their neighbors.
That isn’t a flaw in how the industry works. It’s the honest answer. Transmission upgrades are shared infrastructure, so when four projects in the same electrical pocket overload a transformer between them, there’s no fair way to bill one of them for all of it. There’s also no way to find that overload by studying them one at a time.
So a cluster study asks two questions. What does this group of projects break, and who pays for each fix. Here’s how we built ours.
Why one project at a time isn’t enough
Our application already answered two narrower questions.
A screening study sweeps candidate points of interconnection across a region and estimates how much a project could inject at each one. The output is a ranked list of places worth connecting. It’s a siting tool, and an expensive one, because it tests every eligible bus or line tap in scope.
An injection study takes one project at one point of interconnection and finds how much it can inject before the first thermal constraint binds, and which facility that is.
Both are useful, and both model a single project against a system that doesn’t contain the others. That hides the two things a cluster study is for. Two generators that each pass their own injection study can overload a facility together that neither one troubles alone. And an injection study can tell you a facility needs upgrading, but not what share of it you owe, because with one project the answer is always all of it.
The rules changed to match. FERC’s Order 2023 moved the industry off serial, first-come-first-served study processes and onto cluster processes, where a group of requests is studied together and shares the cost of what it requires. The unit of analysis is the group now, in the tariff as well as in the physics.
The obvious approach doesn’t work
Build a case without the cluster. Build a case with it. Run contingency analysis on both. Anything overloaded in the second and not the first is the cluster’s fault, and the cost gets split across whoever contributed.
Every step of that sounds reasonable. Three things go wrong.
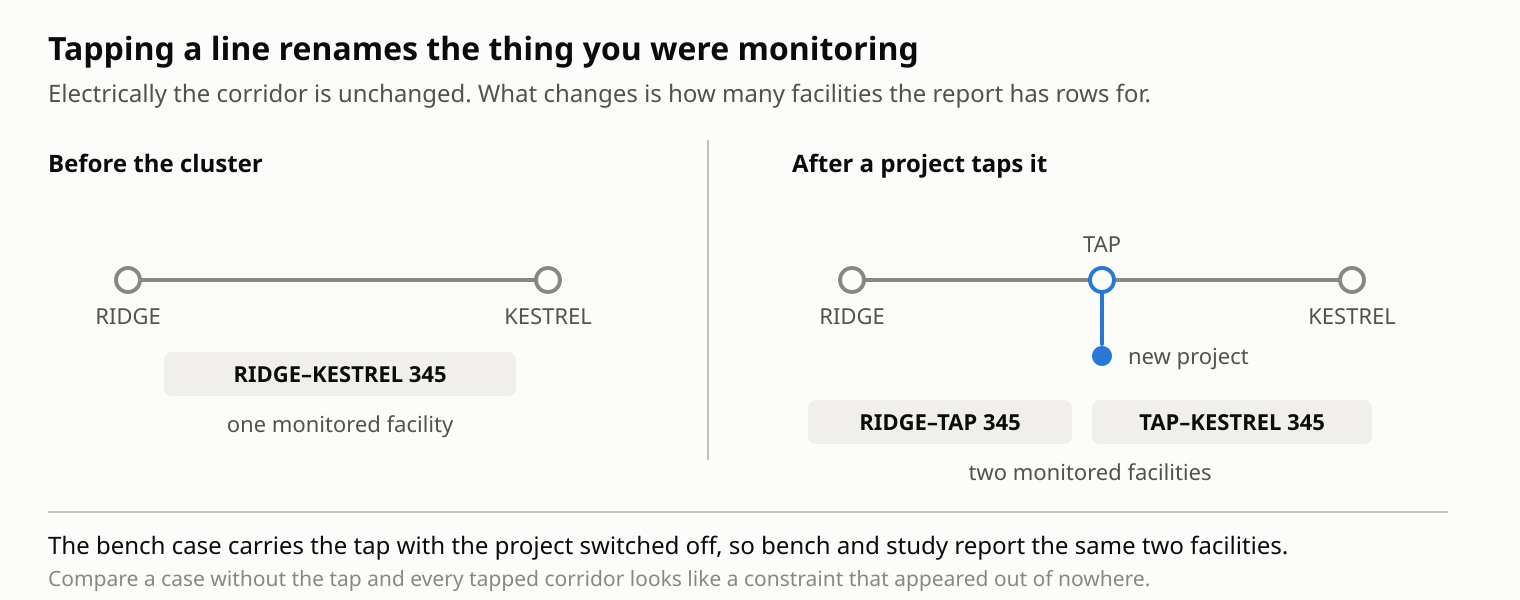
The two cases don’t report the same facilities. Projects connect by tapping existing lines, which splits a line in two and adds a bus in the middle. Electrically that’s mostly harmless, since the segments carry the flow the original line carried. But the pre-cluster case reports a facility from bus A to bus B, and the other case reports A-to-tap and tap-to-B. Compare them by name and every tapped line looks like a new overload.
“Newly overloaded” is the wrong test. Contingency analysis gives you a row per facility per contingency. But a facility is rebuilt once, sized to whatever contingency stresses it worst. A line already over its limit before the cluster arrives is somebody’s existing obligation, even if the cluster overloads it under a different contingency. Comparing row by row bills a developer for a rebuild that was going to happen anyway.
One threshold isn’t the rule. The usual filter is a sensitivity cutoff: if a generator’s effect on a constrained facility clears some number, it’s responsible. Every market defines that differently, and no single number covers them.
Three cases instead of two
The first problem is fixed with a third case. We build base, then bench, then study, each one from the last.
- Base gets the existing system into the right starting state. Previously queued projects are dispatched at the levels their market specifies, any generators being retired are taken offline, and the resulting surplus or deficit is offset.
- Bench adds the cluster’s topology to that case: buses, transformers, tap points, interconnection branches. Every cluster generator is offline, at zero megawatts.
- Study takes the bench case and turns those generators on.
Bench looks like it does nothing. The generators are off, and the topology it adds is mostly radial, so the flows barely move. What it buys is a fair comparison. Bench and study contain the same network, so contingency analysis reports the same facilities under the same names in both. Every tapped line is already two segments on both sides. Nothing appears or disappears, so the only difference left is the one the cluster’s generation caused.
Contingency files have to keep up too. Once a line is tapped, the outage definition we inherited names a line that no longer exists, so we expand it into one outage per segment. And each case records whether it actually converged. If one doesn’t, the run stops and says so, because a case that didn’t solve will still produce a full set of numbers.
Deciding whose fault it is
For each monitored facility we take its worst loading across all contingencies in the bench case, then its worst across all contingencies in the study case. The facility is the cluster’s obligation when the bench number stays under 100% and the study number goes over.
That comparison is per facility, not per facility and contingency, because you rebuild a line once. The unit of comparison should match the unit of construction.
Cost works the same way. Each facility is priced once, and each generator’s contribution is its largest impact on that facility, with the cost divided in proportion.
Pricing turned up a quiet problem. Line rebuild cost is dollars per mile times miles, and power flow models sometimes leave a line’s length blank. Zero miles meant zero dollars, so a real overload was correctly identified and then priced at nothing, with no cost allocated to anyone. The study finished without errors. There was nothing to notice except the number.
We now estimate missing lengths from the line’s electrical reactance, using typical per-mile values for its voltage class. It’s an approximation, so every estimated length is flagged as one in the results. A length someone can disagree with is worth more than a zero nobody questions.
Every market has its own rulebook
Which generators are responsible for a constraint, and how much of the bill each one carries, is written down in each market’s tariff or business practices. Those documents don’t agree with each other.
One market’s test really is a single sensitivity threshold. Another defines several independent tests and a generator qualifying under any of them is responsible. One sets different thresholds for high-voltage facilities than for lower-voltage ones. Another assigns responsibility by proportional share: each request’s impact as a fraction of the whole cluster’s impact on that facility, with small shares dropped and the rest recalculated.
Two of those can’t be answered one generator at a time. A proportional share depends on every other request’s impact. And some markets include a group fallback, where nobody clears the individual bar but the group’s combined impact does, and then the largest individual contributors become responsible after all.
So instead of a cutoff we built a small set of reusable tests, each parameterized: sensitivity above some value, impact above some share of the facility’s rating, a test that only applies above a certain voltage. Each market’s rules are assembled from those pieces. Evaluation happens in two passes, generators first and groups second, so a group rule can see who already qualified.
Every market must have an entry. There’s no default, and a test fails the build if one is missing. This sounds bureaucratic and isn’t. A market that inherits someone else’s thresholds by accident still produces a complete, plausible, internally consistent set of cost allocations, computed under rules that apply to nobody. That isn’t something you catch by reading the results.
Dispatch levels work the same way. How much a queued generator is modeled at comes from a per-market table rather than one global assumption. MISO, for instance, sets it by prime mover and season, with summer wind at 18.1% and solar at 100% in summer and 47% in the shoulder season. A queued wind farm modeled at 100% instead of 18.1% is a different study, with different upgrades and different projects paying for them.
Something has to give up the megawatts
When you add four gigawatts of generation to a case, something else has to come down. You back generation off somewhere: in each project’s own area, across a wider region, across the whole footprint, or off-system. It sounds like bookkeeping, but where those megawatts come from largely determines what flows across the seams, and two sensible-looking choices can differ by hundreds of megawatts on a path somebody cares about.
So it’s an ordered chain the user builds rather than one setting. Back generation down here first, and when that runs out, move to the next. Whether any given option can absorb what you’re asking comes down to how much generation inside it is running far enough above its minimum to be worth reducing, and how big the offset is. Neither is obvious from the name.
Season matters more than people expect. A summer peak case has a lot of generation committed and running hard to cover load, which is exactly when there’s room to bring it down. The same footprint in a shoulder season has less of that fleet online, so a chain that absorbed several gigawatts at peak can fall short of a smaller cluster in a milder case.
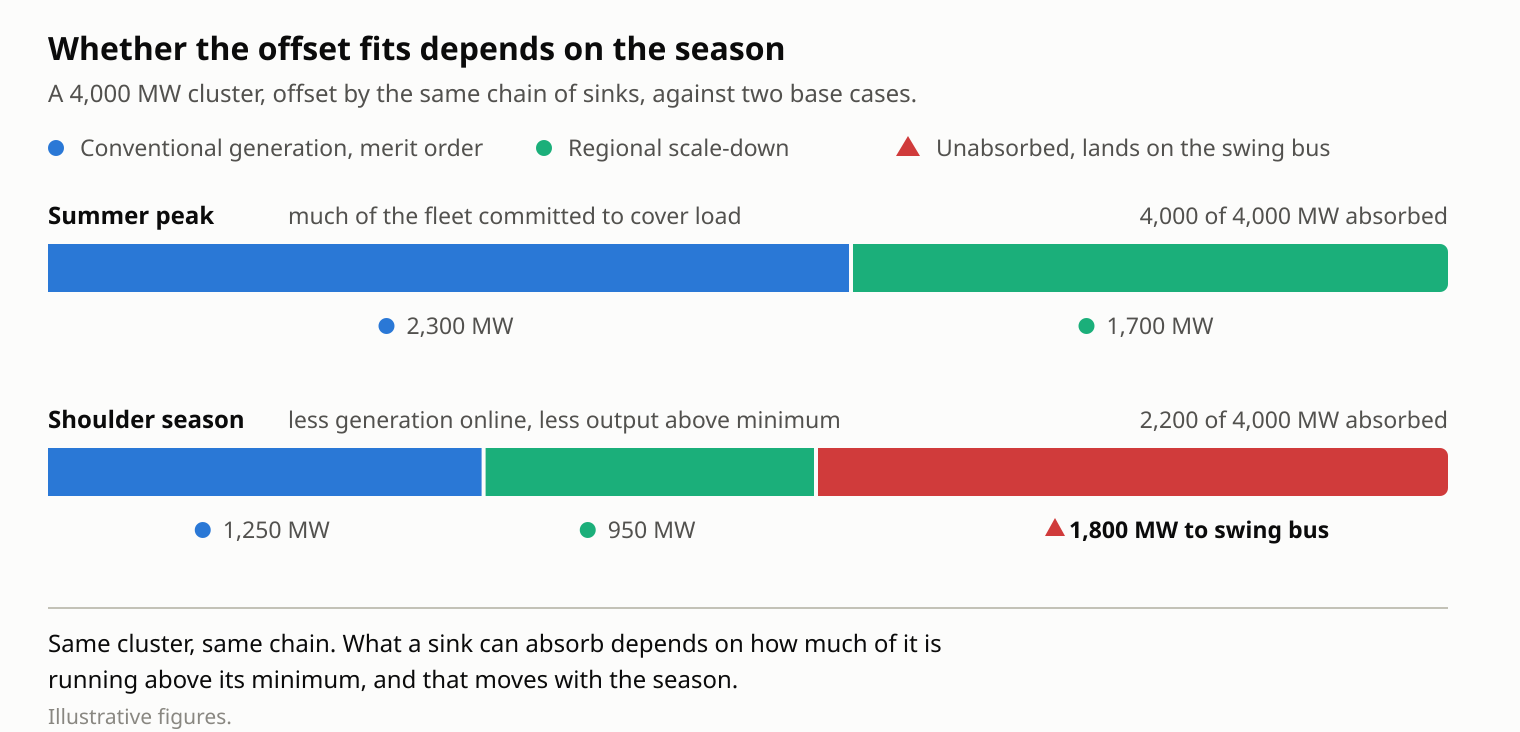
Megawatts that nothing absorbs don’t disappear. They land on the swing bus, the case’s bucket of last resort, and a case balanced by pushing two gigawatts onto one machine isn’t one you want conclusions from. It will often still solve.
So the interface checks the chain before anything is built. It walks the megawatts down the tiers the user configured, using real values from the model, and reports where they would run out and by how much. The warning appears while the user is still choosing, not later.
What we’re watching for
Every problem in this post looked fine on the page. A line priced at zero. A pre-existing overload charged to a cluster. A tapped line counted as a new constraint. None of them arrived as bug reports, because none of them looked like bugs.
So the thing we’re most careful about isn’t the arithmetic. It’s whether someone reading a result can tell where each number came from: which lengths we estimated, what fraction each queued project was dispatched at, which market’s rules decided responsibility, and where the offsetting megawatts went. A number somebody can argue with is worth more than a number that’s merely correct.
Loved the article? Hated it? Didn’t even read it?
We’d love to hear from you.